

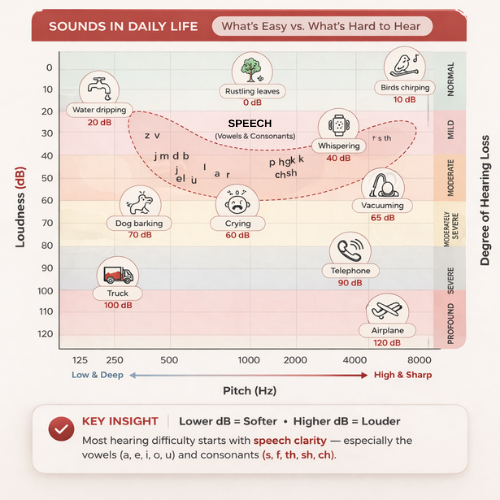
- An audiogram is a graph that shows your hearing ability across different pitches (frequencies) and loudness levels (decibels), helping you understand exactly which sounds you can hear clearly and which ones you may be missing.
- The horizontal axis shows pitch—from low sounds like thunder to high sounds like birds. The vertical axis shows how soft a sound you can hear. The lower the symbols appear, the louder sounds must be before you can hear them, which means greater hearing loss. Normal hearing is near the top of the chart. As the symbols move downward, it indicates increasing difficulty hearing softer sounds, especially speech.
- Different symbols mark results for each ear: typically “O” for the right ear and “X” for the left ear. The pattern and position of these symbols show your hearing levels across pitches, while additional measurements help determine whether the hearing loss is conductive, sensorineural, or mixed.
- Understanding your audiogram helps explain real-life challenges, such as why conversations in a noisy kopitiam or during family dinners can feel exhausting, even when people seem to be speaking loudly enough.
- At Clarisound, we always have a qualified MAHPC-registered audiologist explain your results in person, because an audiogram is just the starting point of a full rehabilitation journey: accurate diagnosis, appropriate device selection (if needed), expert fitting, and lifelong aftercare.
Customers in Malaysia can book a free hearing test with us to receive a personalised audiogram explanation.
1. What Is an Audiogram and Why It Matters for Your Hearing Health
Think of an audiogram like an eye prescription, but for your ears instead of your eyes. Just as an optometrist measures how clearly you see letters at different sizes, an audiologist measures how well you hear sounds at different pitches and volumes. The audiogram is the resulting graph that captures these measurements.
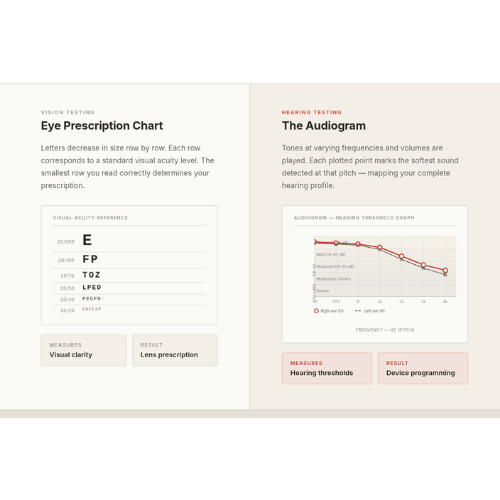
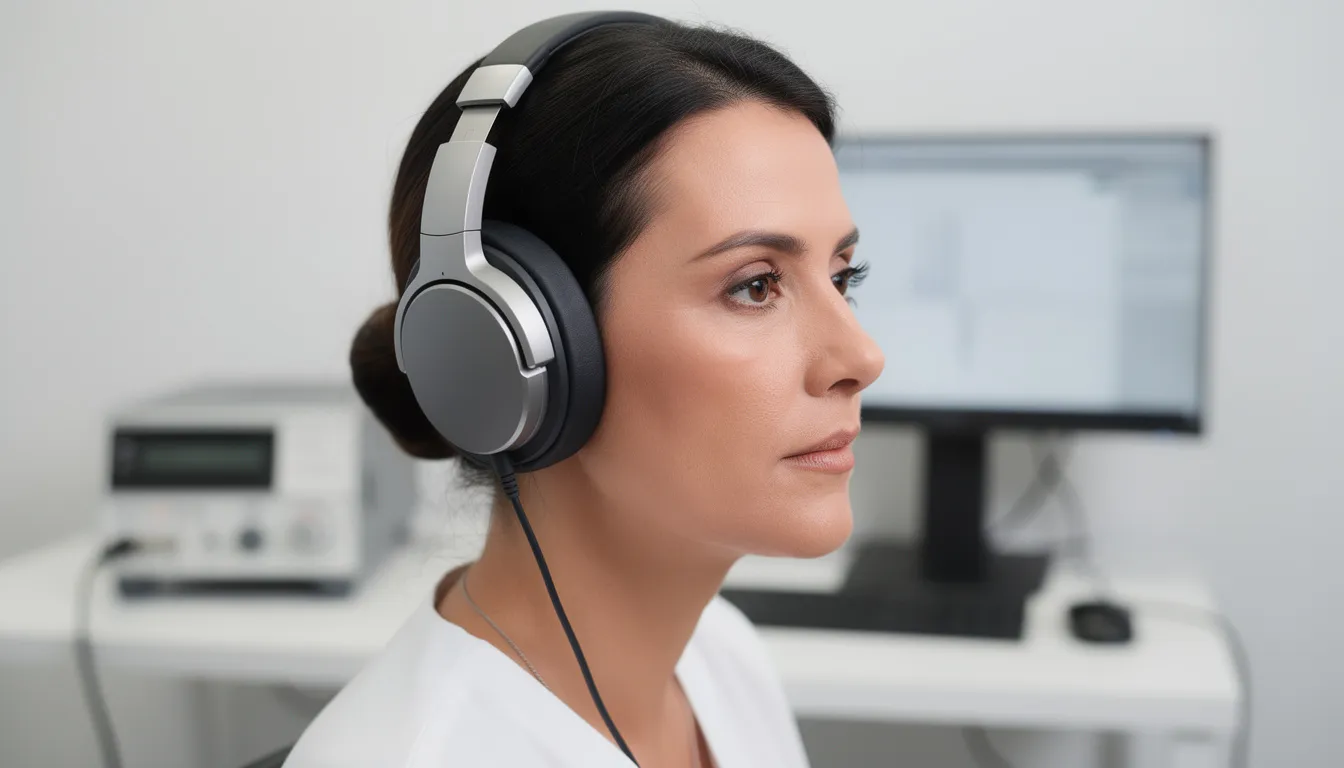
An audiogram is produced during a pure tone hearing test, where you listen for the softest sound you can detect at various frequencies ranging from 125 Hz to 8,000 Hz. These frequencies cover the key range of human speech, from deep vowel sounds to sharp consonants like “s” and “sh.”
We often hear customers ask about percentage of hearing loss. It is important to note that hearing is not measured as a percentage because hearing loss does not affect all sounds equally. You may hear some pitches well but miss others entirely—especially those important for speech clarity. Instead, results are recorded in decibels Hearing Level (dB HL), which shows the softest sounds you can hear at each pitch. This gives a far more accurate picture of your real hearing ability.
Your audiogram helps identify whether your hearing threshold falls within the normal hearing range or indicates one of the main types of hearing loss:
- Conductive hearing loss occurs when there is a problem in the outer and middle ear that prevents sound from reaching the inner ear properly
- Sensorineural hearing loss originates in the inner ear or hearing nerve
- Mixed hearing loss involves both conductive and sensorineural components
At Clarisound, your audiogram is not just presented with a cursory explanation —it is carefully explained in the context of your daily life. We take the time to walk you through your results, connecting each finding to real-world situations—whether that means hearing your grandchildren clearly, understanding TV dialogue without raising the volume, following sermons at the mosque, or participating confidently in work meetings.
An audiogram provides valuable information, but it is only one part of a complete assessment. We complement it with video otoscopy to examine the health of the ear canal and eardrum. Together, these insights give a more complete and meaningful picture of your hearing before any recommendations are made.

2. The Anatomy of an Audiogram: Understanding the Graph
When you first look at an audiogram, you will see a chart with two main axes. The bottom line (x-axis) represents frequency, and the side line (y-axis) shows the softest level of sound you can hear, measured in decibels Hearing Level (dB HL). Once you understand what each axis means, learning how to read an audiogram becomes much more straightforward.
The Horizontal Axis: Frequency (Pitch)
The frequency axis represents pitch—how high or low a sound is. Frequency is measured in Hertz (Hz), and the test typically assess key points across the speech range:
| Frequency | Type of Sound | Real-World Examples |
|---|---|---|
| 125–250 Hz | Low frequency | Thunder, bass drums, lower tones of male voices, background rumble |
| 500–1,000 Hz | Mid-frequency | Vowel sounds (which carry volume and fullness in speech), everyday background sounds eg refrigerator hum |
| 2,000–4,000 Hz | Mid-high frequency | Critical speech clarity sounds, especially consonants like “t,” “k,” “p,” “f” |
| 6,000–8,000 Hz | High frequency | Fine detail sounds such as “s,” “sh,”and birds chirping, children’s voices |
The lowest frequency tested appears on the left side of the graph, with the frequency range increasing as you move right. Understanding where different speech sounds fall on this axis helps explain why you might hear some sounds clearly but struggle with others.
Why This Matters
Speech is not a single sound—it is a combination of low-frequency power (vowels) and high-frequency clarity (consonants).
Most age-related hearing loss (presbycusis) affects the higher frequencies first.
This is why many people say:
👉 “I can hear people talking, but I can’t understand what they’re saying.”
They are hearing the volume, but missing the detail.
Simple Way to Think About It
Think of speech like a piano:
- The left keys (low notes) give richness and loudness
- The right keys (high notes) give clarity and meaning
If the higher notes are missing, the melody is still there—but it becomes harder to recognise.
The Vertical Axis: Loudness (Decibels)
The vertical axis shows the softest level of sound you can hear, measured in decibels Hearing Level (dB HL). It typically ranges from around -10 dB HL at the top (very soft sounds) to 120 dB HL at the bottom (very loud sounds).
Here is the key point that can seem counterintuitive: the graph is “upside down”. The top of the graph represents better hearing because you can detect very quiet sounds. The further down a symbol appears on the graph, the louder sounds need to be before you can hear them—indicating greater hearing difficulty at that given frequency.
Each symbol on the audiogram represents the softest sound you can reliably hear at a specific pitch. Symbols near the top of the chart (typically within 0 to 25 dB HL) are considered within normal hearing limits in adult clinical practice.. When the symbols appear lower on the chart, it means those pitches need to be louder before you can hear them—showing a degree of hearing loss at those frequencies.
This pattern shows which parts of speech you are likely missing.
You may hear some sounds clearly while others require more amplification—this is why hearing loss is not experienced as a simple “volume problem,” but as a selective loss of clarity across different pitches.
At Clarisound centres in Malaysia, our test environments are sound-treated to eliminate background noise. This ensures that the thresholds we plot on your audiogram accurately reflect your true hearing sensitivity, not interference from air-conditioning units or traffic outside.
3. Reading the Symbols: What the X’s and O’s Mean for Each Ear
The same audiogram displays results for both your left and right ears, using different symbols and often different colours to distinguish between them. Most audiograms use red markings for the right ear and blue for the left ear.
Air Conduction Symbols
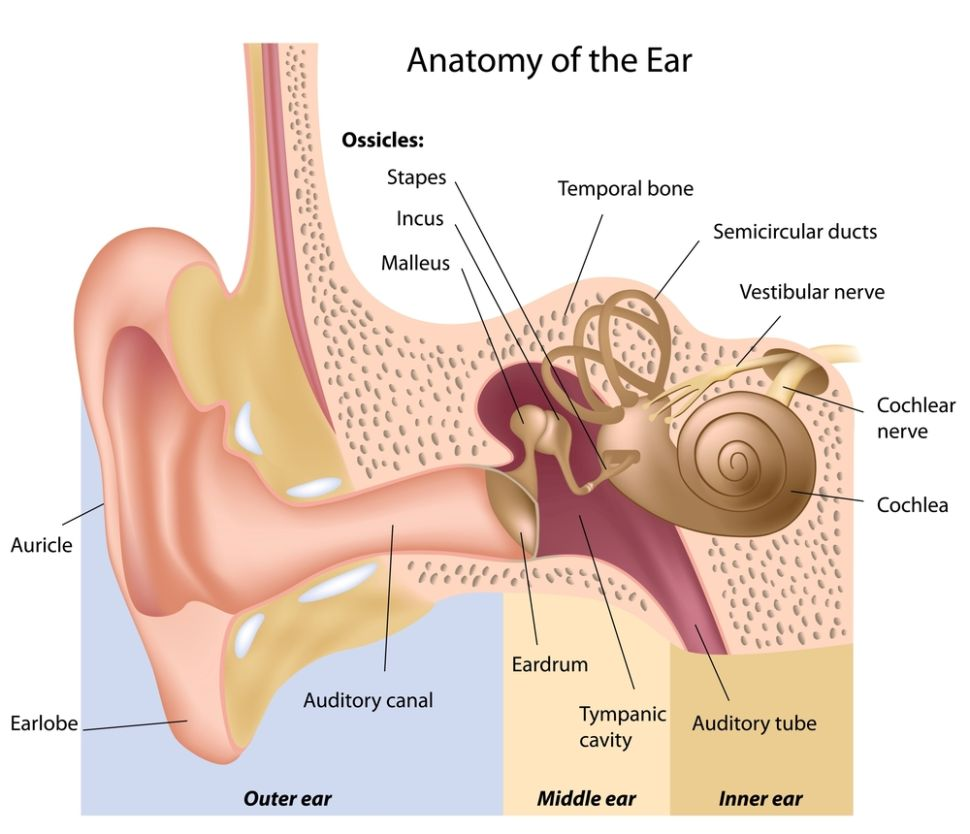
Air conduction testing measures how sound travels through : entering the entire hearing pathway – from the outer ear canal, vibrating the eardrum and the tiny bones in the middle ear space, and finally reaching the inner ear. This is tested using headphones or insert earphones, allowing the audiologist to measure how well this full pathway is functioning.
Air conduction results reflect overall hearing ability, but they do not, on their own, pinpoint where a problem may be occurring.
This is why they are interpreted alongside other tests (such as bone conduction) to determine the type of hearing loss.
The standard symbols for air conduction results are:
- O (usually red): Right ear tested with headphones
- X (usually blue): Left ear tested with headphones
Some audiograms may use triangles or squares instead, but “O” and “X” are the most common symbols you will encounter. When our audiologist shows you your results, you can trace the connected O symbols to see the “shape” of your right ear hearing, and the connected X symbols for your left ear hearing.
Bone Conduction Symbols
Bone conduction testing works differently. A small vibrating device is placed on the mastoid bone behind your ear, sending sound directly to the inner ear and bypassing the outer and middle ear entirely. This helps us understand whether any hearing loss occurs in the inner ear itself or in the structures that transmit sound before reaching it.
Bone conduction thresholds use these symbols:
- < or [ bracket: Right ear bone conduction
- > or ] bracket: Left ear bone conduction
Understanding the Air Bone Gap
By comparing bone conduction results with air conduction results, the audiologist can determine where the hearing loss is occurring—whether in the inner ear (sensorineural) or in the outer or middle ear (conductive) or a mix hearing loss.
- When Air and Bone Results Are Similar: When air and bone conduction thresholds are similar (typically within about 10 dB), this suggests there is no significant air–bone gap. If hearing loss is present, it is most consistent with sensorineural hearing loss—meaning the issue lies in the inner ear or auditory nerve.
- When Bone Is Better Than Air: When air conduction results are significantly worse (lower on the graph) than bone conduction thresholds by more than 10–15 dB, this suggests a conductive component—something in the outer or middle ear is blocking or reducing how sound reaches the inner ear, which may be caused by earwax, fluid, or middle ear conditions.
- When Both Are Affected (But Bone Is Still Better) If both air and bone conduction show hearing loss, but bone conduction is still better, this indicates a combination of issues. This is called mixed hearing loss.
Why This Matters for You
This distinction is critical because different types of hearing loss require different solutions:
- Conductive issues may be medically treatable
- Sensorineural loss is typically managed with hearing aids
- Mixed loss requires a more tailored approach
During testing, you may occasionally hear a gentle “shushing” sound in one ear while tones are presented to the other. This is known as masking.
It is used to ensure that each ear is tested independently. It prevents the non-test ear from “helping” which could otherwise lead to inaccurate results.
Without masking, results may overestimate the hearing ability of the poorer ear.
By controlling for this, audiologists can obtain a more accurate picture of each ear’s true hearing thresholds.
What You Might See on the Audiogram
Some audiograms include additional symbols to indicate when masking was used. These markings help the audiologist interpret the results correctly for each ear.
During your consultation, your audiologist will walk you through these details so you understand what each symbol means—and how it relates to your hearing in real life.
4. Interpreting Degrees and Types of Hearing Loss on Your Audiogram
When we discuss audiogram interpretation with our customers, two things matter most: how far down the symbols appear on the graph (degree of hearing loss) and the relationship between air and bone lines (type of hearing loss).
Degrees of Hearing Loss
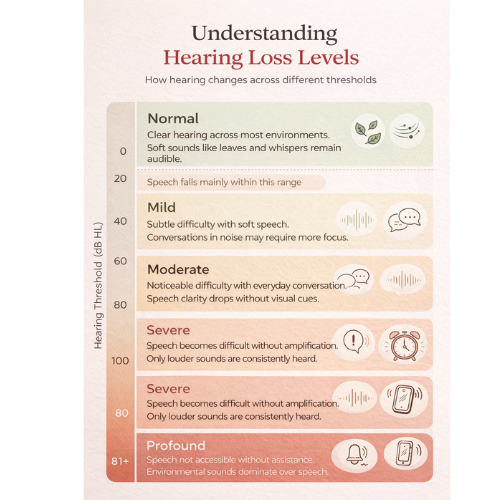
The degree of hearing loss tells us how much louder sounds need to be before you can hear them. While classifications can vary slightly between organisations, the widely accepted categories are:
- Normal hearing: Thresholds between -10 and 20–25 dB HL. You can detect soft sounds within the typical range for adults, including most everyday speech cues.
- Mild loss: Thresholds around 26–40 dB HL. Soft speech, distant voices, and some high-frequency sounds (like “s” or “f”) may be difficult to hear clearly.
- Moderate loss: Thresholds around 41–55 dB HL. Normal conversation, especially in background noise, becomes difficult.
- Moderately severe loss: Thresholds around 56–70 dB HL. Speech needs to be louder and closer to be understood, and group conversations become difficult to follow.
- Severe loss: Thresholds around 71–90 dB HL.Only loud speech is audible, and understanding speech without amplification is significantly limited.
- Profound loss: Thresholds at 91 dB HL and above. Even very loud sounds may not be detected reliably. Communication often relies heavily on amplification, and in some cases, cochlear implant evaluation may be considered.
The speech frequencies (500, 1,000, and 2,000 Hz) are particularly important because they capture much of the energy of everyday speech.
The higher your average thresholds across these speech frequencies, the greater the impact on everyday conversations, meetings, and social gatherings.
These categories are guidelines, not lived experience.
Two people with the same “moderate” hearing loss can function very differently depending on:
- Which frequencies are affected
- Their listening environments
- Their cognitive processing and adaptation
Types of Hearing Loss
Understanding the type of hearing loss helps determine the most appropriate path forward:
Sensorineural hearing loss: When air and bone conduction symbols overlap or fall within about 10 dB of each other—and both show reduced thresholds—the hearing loss occurs in the inner ear or hearing nerve. This is the most common type and includes age related hearing loss (presbycusis) and noise induced hearing loss from years of noise exposure or acoustic trauma. Customers with this type often say, “I can hear people talking, but I cannot understand the words clearly.”
Conductive hearing loss: When bone conduction thresholds are significantly better (higher on the graph) than air conduction results, there is a problem in the outer or middle ear preventing sound from reaching the inner ear efficiently. This might be caused by fluid in the middle ear, earwax blocking the ear canal, a foreign body, tympanic membrane perforation, negative pressure, or issues with the tiny bones that transmit sound. Customers typically describe sounds as “muffled” or “blocked.” In some cases, medical or surgical intervention may restore hearing.
Mixed hearing loss: When both air and bone thresholds are lowered (indicating sensorineural involvement) AND there is also a visible gap between them (indicating a conductive component), both parts of the hearing system are affected.
At Clarisound, audiogram results are interpreted within the context of your overall hearing profile—not in isolation.
We take into account your lifestyle, medical and hearing history, current medications, and the specific listening situations that matter most to you.
This allows us to translate your test results into practical recommendations—so any solution is aligned not just with your hearing levels, but with how you live, communicate, and engage in everyday life.
5. Understanding the Speech Banana: Why Some Sounds Are Harder to Hear
Many audiograms include an overlay called the speech banana—a banana-shaped area stretching across the middle frequencies (roughly 250 to 6,000 Hz) where most speech sounds fall. Understanding this concept helps explain why you might catch some words perfectly but completely miss others.
Where Different Speech Sounds Sit
Within the speech banana, different sounds occupy different positions:
- Vowel sounds (“ah,” “oo,” “eh”) sit in the lower-to-mid frequencies and tend to be louder. They carry the power and rhythm of speech.
- Consonants like “s,” “f,” “sh,” “ch,” “t,” and “k” sit in the higher frequencies and are naturally softer. These sounds carry the clarity and meaning that help you distinguish between similar words.
This distribution explains a common frustration: “I can hear that people are talking, but the words seem unclear.” If your thresholds drop into or below the speech banana at high frequencies, you are likely missing those critical consonants that make human speech intelligible.
Malaysian Examples of Speech Banana Challenges
When thresholds fall below the speech banana, you might experience:
- Difficulty hearing soft consonants when ordering at a noisy kopitiam
- Confusing similar-sounding words in Bahasa Malaysia or English (like “fifty” and “sixty”)
- Struggling to understand your grandchildren’s higher-pitched voices
- Feeling exhausted after family dinners because you are constantly “filling in the blanks”
This listening fatigue happens because your brain works overtime to guess the missing sounds based on context. It is not laziness or lack of attention—it is genuinely hard work.
How Hearing Aids Address Speech Clarity
Modern hearing aids are tuned not simply to make everything louder, but to bring specific speech sounds back into a comfortable, clear zone on the speech banana. During fittings at Clarisound, we may show you how your aided responses shift closer to or into the speech banana after fine-tuning. This is why achieving clarity rather than just volume is so important—and why precise fitting using your individual audiogram matters.

6. Common Audiogram Patterns and What They Might Suggest
Beyond the numbers at each frequency, audiologists also look at the overall “shape” or slope of the lines connecting your thresholds. These patterns can provide clues about possible causes and help guide your hearing care plan.
Classic Audiogram Configurations
Flat loss: Thresholds are similar across all tested frequencies. Everything sounds softer, but no particular pitch range is dramatically worse than others.
High-frequency (down-sloping) loss: Better hearing in the low frequencies, with thresholds dropping as you move to higher frequencies. This is the most common pattern, often associated with age related hearing loss and long-term noise exposure. It explains why bass sounds are clearer than treble, and why male voices may be easier to understand than female or children’s voices.
Low-frequency (up-sloping) loss: Poorer thresholds at low pitches with better hearing in high frequencies. This less common pattern may be seen in certain inner ear conditions.
Notch-shaped loss: A distinct dip at one or two frequencies—often around 3,000 to 6,000 Hz, especially at 4,000 Hz—with better hearing above and below that point. This pattern is commonly associated with specific noise exposure events or prolonged occupational noise exposure.
Unilateral sensorineural hearing loss: One ear shows normal hearing or mild loss while the other shows significantly poorer thresholds. This asymmetry requires careful evaluation to rule out underlying medical causes.
What Patterns Mean for Your Care
When our audiologist reviews your audiogram, they might point to the graph and explain, for example, “This down-sloping pattern explains why male voices are easier than female or children’s voices for you.” This connection between the visual pattern and your daily experience helps make sense of your challenges.
However, patterns alone do not diagnose causes. We always confirm our clinical impressions with your health history, ear examination findings, and additional tests when needed. Only a qualified hearing specialist or hearing care professional should make diagnostic conclusions—online self-interpretations can overlook serious medical issues.
If we notice sudden changes in your audiogram (for example, one ear suddenly much worse than before), this may require urgent medical attention. We will guide you to the appropriate ENT pathway promptly if your results raise any concerns.
7. What Your Audiogram Reveals About Hearing Aid and Rehabilitation Needs
Your audiogram is not simply a pass-or-fail test. It is a detailed map that guides the entire rehabilitation journey—from deciding whether hearing aids will help, to selecting the most appropriate style and technology, to fine-tuning the devices for your unique listening needs.
How Degree and Configuration Guide Decisions
The degree of hearing loss and the pattern across frequencies help us determine:
- Whether amplification is likely to provide meaningful benefits
- Which hearing aid style and technology level are most appropriate
- How much emphasis to place on high-frequency clarity versus overall loudness
Recommendations Based on Your Results
- For mild loss: We discuss communication strategies, regular monitoring, and may suggest discreet devices such as invisible when worn CIC if you are struggling in noisy environments. Though not everyone with mild loss needs hearing aids immediately, but many benefit from early intervention.
- For moderate to severe loss: We strongly recommend amplification to prevent social withdrawal, listening fatigue, and other effects of untreated hearing loss. At this level, hearing aids can make a significant difference in quality of life.
- For severe or profound loss: We discuss advanced amplification options and, when appropriate, referrals for cochlear implants assessment alongside powerful hearing aids.
Our Technology Partners and Fitting Approach
At Clarisound, we partner exclusively with trusted brands like Signia and Rexton because of their unmatched quality, innovation, and value. These advanced digital hearing aids can be precisely tuned to match your individual audiogram and suit Malaysian listening environments—from quiet home settings to busy markets and family gatherings.
Crucially, we use Real-Ear Measurement (REM) during fittings. This means we place a tiny microphone in your ear canal while you wear the hearing aid, measuring exactly what sound is being delivered. This verification ensures the amplification truly matches the targets calculated from your audiogram—not just a generic estimate. REM is what separates precise, comfortable, effective fittings from “good enough” guesswork.
Ongoing Care Matters
After your initial fitting, we review your hearing profile regularly during aftercare visits. Hearing can change over time, and lifestyle needs evolve. By tracking your hearing test results over the years, we can adjust your hearing aid settings proactively, ensuring you continue to hear clearly as life changes.
8. Questions to Ask Your Audiologist About Your Results
We encourage you to ask questions during your consultation—no question is “too simple.” Understanding your hearing is important, and our MAHPC-registered audiologists are here to help you make sense of the numbers and lines.
Questions About Your Diagnosis
- “Is my hearing within the normal hearing range, or what degree of hearing loss do I have in each ear?”
- “Is my hearing loss sensorineural, conductive, or mixed? What does that mean for treatment?”
- “How does my audiogram explain the difficulties I notice at family gatherings, at work, or in places like kopitiams or markets?”
Questions About What You Are Missing
- “Which sounds or speech consonants am I most likely missing based on this graph?”
- “Can you show me where my thresholds fall relative to the speech banana?”
- “Why do I find certain voices harder to understand than others?”
Questions About Next Steps
- “Would you recommend hearing aids now, or could we monitor my hearing first? What are the pros and cons in my case?”
- “How often should I re-test my hearing based on my current results?”
- “Can you show me how my aided hearing compares to normal hearing levels if I try hearing aids?”
A Note About Our Approach
At Clarisound, our audiologists are non-commissioned. This means our discussions focus entirely on what is clinically best for you—not on selling a particular device or brand. We want you to leave every appointment feeling informed and confident about your choices.
Adult children are always welcome to attend appointments with their parents. Having a second set of ears helps ensure nothing is forgotten, and families can work together to support their loved ones’ hearing journey.
9. Next Steps: Choose the Right Hearing Solution
Understanding your audiogram is the first step toward clearer, more comfortable hearing in your daily life. But an audiogram alone cannot help you hear better—it needs to be part of a complete hearing rehabilitation pathway guided by qualified professionals.
The Clarisound Rehabilitation Pathway
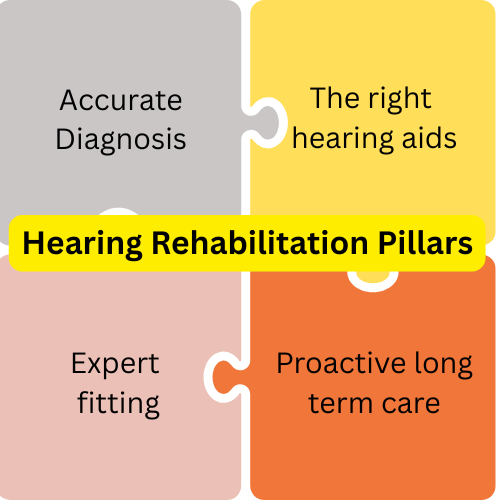
Step 1: Accurate Diagnosis
Comprehensive hearing test and audiogram A MAHPC-registered audiologist conducts pure tone audiometry, speech reception threshold testing, and other assessments as needed in a sound-treated environment. Clear explanation of results We walk through your audiogram in everyday language, linking the graph to your real listening situations—not just numbers on a page.
Step 2: The Right Hearing Aid
Discussion of options Together, we explore whether hearing aids are recommended, what communication strategies might help, and what follow-up plan makes sense for your lifestyle.
Step 3: Expert Fitting
Precise fitting using Real-Ear Measurement If hearing aids are appropriate, we fit them using REM to ensure the amplification matches your audiogram targets exactly.
Step 4: Proactive Long Term Care
Regular aftercare, fine-tuning, and re-testing Hearing changes over time. We provide proactive, lifetime support to keep your hearing on track, adjusting settings as needed and monitoring for any shifts in your audiogram.
Addressing Common Concerns
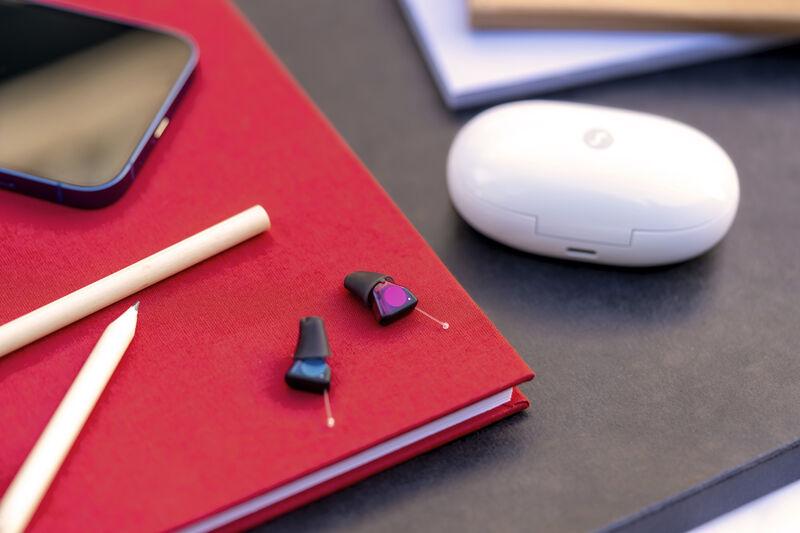
For seniors worried about stigma or technology, modern devices have come a long way. Today’s hearing aids can be very small, rechargeable, and Bluetooth-enabled for seamless connection to your TV, phone, and other devices. Many customers tell us their family and friends do not even notice they are wearing them.
Leaving hearing loss untreated can increase fatigue, social isolation, and frustration. But taking action—guided by your audiogram and supported by professionals—can make conversations enjoyable again.
Getting Started
If you already have an audiogram from another hearing care provider, you are welcome to bring it to us for a second opinion. If you have never had a hearing test, you can book a free hearing assessment with our team to get started on the path to clearer hearing.
Book a Free Hearing Test | Chat with an Audiologist

10. FAQs About Audiograms and Hearing Tests
Can my hearing improve, or will my audiogram always look the same?
Some types of hearing loss can improve with medical treatment. For example, if conductive hearing loss is caused by fluid in the middle ear or a blockage in the ear canal, treating the underlying issue may restore hearing to near-normal levels. However, age related hearing loss and noise induced hearing loss are sensorineural and permanent. In these cases, our focus shifts to rehabilitation—using hearing aids, communication strategies, and ongoing support to help you hear as clearly as possible.
How often should I repeat a hearing test in Malaysia?
For adults over 50 with results in the normal range, we generally recommend re-testing every 1-2 years to detect any gradual changes early. If you have diagnosed hearing loss, a history of significant noise exposure, or wear hearing aids, annual testing is usually advisable. We will recommend a schedule based on your individual situation, and you can always request a test sooner if you notice changes in your hearing ability.
Is an online hearing test enough to get an accurate audiogram?
Online hearing tests can serve as a screening tool, but they cannot replace a proper clinical assessment. Accurate audiogram interpretation requires calibrated equipment in a sound-treated room, both air conduction testing and bone conduction testing, masking when needed. Proper diagnosis and safe hearing aid fitting must be done by a qualified hearing care professional attending to you in person. At Clarisound, our comprehensive assessments follow clinical best practices to ensure accuracy.
What if my audiogram looks “normal” but I still struggle to hear in noise?
Some individuals experience “hidden” hearing difficulties that do not show up on a standard pure tone audiogram. In these cases, the challenge may lie not in detecting sounds, but in how the brain processes and organises them—particularly in complex listening environments such as conversations in noise.
Do I need a referral to get an audiogram at Clarisound?
In Malaysia, you can book directly with us for a free hearing test—no referral is needed. If your audiogram or case history suggests any medical concern (such as sudden hearing loss in one ear, ear pain, discharge, or other symptoms), we will refer you to an ENT specialist for further evaluation. Our role is to guide you through the entire process, ensuring you receive appropriate care whether that involves hearing aids, medical treatment, or simply ongoing monitoring.
At Clarisound, we believe that understanding your audiogram empowers you to make informed decisions about your hearing health. Whether you are taking your first hearing test or seeking a second opinion on existing results, our MAHPC-registered audiologists are here to guide you—with expertise, patience, and genuine care.